Options within the View menu are used to control the graphical
display of points, lines and other data types within the current
job and to provide certain types and levels of information
concerning data stored within the job database.
Point Display Options
Points displayed on-screen may be annotated with up to two
associated values such as point numbers or descriptions, or as the
point marker only. These options determine what information is
displayed.
|
|
Points are displayed as either a cross (un-fixed points) or a
solid triangle (fixed points). |
|
|
In addition to the point marker (a cross for un-fixed points or
a solid triangle for fixed points), the point's number is printed
on the right side. |
|
|
In addition to the point marker (a cross for un-fixed points or
a solid triangle for fixed points), the point's description is
printed on the right side. |
|
|
In addition to the point marker (a cross for un-fixed points or
a solid triangle for fixed points), the point's height value is
printed on the right side. |
|
|
In addition to the point marker (a cross for un-fixed points or
a solid triangle for fixed points), the point's geoid-spheroid
separation (undulation) value is printed on the right side. |
|
|
In addition to the point marker (a cross for un-fixed points or
a solid triangle for fixed points), the point's gravitational
deflection values are printed on the right side. |
|
|
In addition to the point marker (a cross for un-fixed points or
a solid triangle for fixed points), the point's derivation code is
printed on the right side. Refer to the List Points / Export topic
and the Derivation Codes sub-heading for a list of possible
derivation codes. |
|
|
Points adjusted in GPS point observations entered on the
Network Points tab in Least Squares
Network Adjustment are displayed with a green circle around
the point cross. |
|
Return to Section
Titles
Line Display Options
Lines displayed in Geoida are observation lines, simply
lines over which one or more observations have been made - they are
not necessarily linear features that have been surveyed with
the intention of having the processing software string the points
together into linework to define natural or man-made features.
The encoding of surveyed points during the field observation
process for the automatic stringing of like-coded points by
post-survey processing software has no bearing on Geoida. However,
all code information is preserved by Geoida for export.
The purpose of displaying the observation lines within Geoida is
to help to make the recognition and identification of the structure
of the survey, or portions of it, more obvious during the data
processing stage. The lines that may be displayed in various forms
are created automatically during data reduction - no new lines can
be drawn or defined manually, and none of these lines are exported
from Geoida for any other purpose.
The line display options are simply toggles to turn various
types of lines on or off.
Lines can only exist where the end-points exist. If a
point is deleted to which one or more lines have been drawn
then all of those lines are deleted also. Lines may be deleted
without deleting its end-points - see the Delete Window option for more
information.
Note - it does not matter how many times a particular set
of data is processed. Any particular line between two points,
regardless of the number of different observations that may have
been made over that same line, can only occur once in the database
- it is never duplicated.
The line types that may be displayed are as follows …
|
|
Spirit-levelling or height differences |
|
|
Multiple pick-up observations made from one instrument
station |
|
|
Traverse route between successive set-ups |
|
|
Base lines, reference bearings, etc between control points |
|
|
Angle, bearing/azimuth or direction observations adjusted by
least squares |
|
|
Horizontal distance observations adjusted by least squares |
|
|
Slope distance observations adjusted by least squares |
|
|
Vertical angle observations (zenith angles) adjusted by least
squares |
|
|
GPS baseline vector observations adjusted by least squares |
|
Return to Section
Titles
General
This section gives details of a number of general display
options.
|
|
This option displays the geoid model in either of the following
forms depending on the geoid Interpolation method defined in
Job Configuration:

|
|
Figure 2: Fixed-point TIN - This
option displays the triangle mesh of the three-dimensional geoid
model created by the Points menu Form TIN Geoid Model option.
Each triangle represents a flat plane between the three apex
points; the centroid of each triangle is marked with 'o'
|
|
|
|
|
|
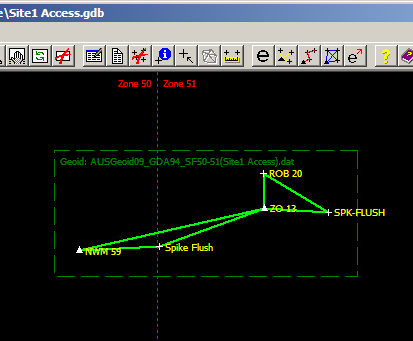
Figure 3: Bi-cubic/Bi-linear method
using geoid grid-file - This option displays the boundary of
the area covered by the currently defined geoid grid-file; if the
originally selected geoid file has been windowed by Geoida to
reduce the geoid data to a smaller area immediately surrounding the
extents of the job, the job name will be included in the grid-file
name as shown. The boundary of the windowed area will be positioned
up to 5 times the grid interval outside the job extents and will be
enlarged automatically if new points are added that fall too close
to or outside the boundary
|
|
|
|
Please refer to the Plot
Geographic topic for details of this option. Note that
Plot Geographic is also available directly in the
View menu - when job data has been plotted in Geographic
mode (coordinates as latitude and longitude) a check-mark is placed
next to the item in the View menu. |
|
|
Zone boundaries may be displayed in any job having the
Coordinate Type defined in Job Configuration set as
either Grid Projection or Geographic.
.PNG)
|
|
Figure 4: Standard multi-zone
projection - The eastern and/or western zone boundaries may be
displayed depending on job location and zoom scale but only for the
zone defined as the Default TM Zone for the job and the
immediately adjacent zones
|
|
|
|
.PNG)
|
|
Figure 5: Single (project or special
area) zone projection - One or up to all four zone extents may
be displayed depending on job location and zoom scale
|
| Note: |
- Zone boundaries will normally be displayed on-screen only where
the job is located near a zone boundary, or when the view is zoomed
out to a sufficiently small scale that one or more zone boundaries
are spanned.
- Zone boundaries will still be shown when the job data is
displayed as Geographic coordinates, ie Plot Geographic mode may be
either on or off - refer above.
|
|
|
|
The scale bar is a feature that can be turned on or off as
required (for grid coordinates only - not available in Plot Geographic mode). In
addition, if its current position is not suitable (eg, the default
position in the lower left corner of the display), it can be
dragged into any other position as required. To drag the scale bar
to a new location, moving the mouse over it will cause the cursor
to change to a four-headed N-S-E-W arrow - while this cursor shape
is shown, click and hold the left mouse button, drag the scale bar
away and drop into its new position by releasing the mouse button.
The scale bar shows the ground distance indicated on the bar as
a multiple of 5 or 10, depending of the size of the actual area
currently displayed. The bar will be seen to change size as windows
are zoomed inwards or outwards. The indicated distance unit changes
from metres to kilometres as the window dimension expands. Note
that a window cannot be zoomed to less than 0.2m in the east-west
dimension. The keyboard shortcut for this option is Ctrl +
S. |
|
|
Select this option to reset the scale bar to its default
position in the lower-left corner of the display. Sometimes after
extensive zooming and panning at extreme scales (either large or
small), the scale bar may become partially or totally lost off the
display - if this occurs, it may be recovered by refreshing the
display with this checkbox off and then turning it on again. The
keyboard shortcut for this option is Ctrl + F. |
|
Return to Section
Titles

